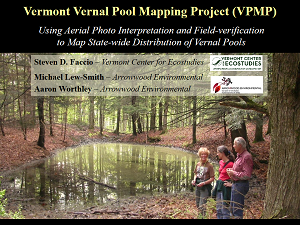
The Vermont Vernal Pool Mapping Project: Using Aerial Photo Interpretation and Field-verification to Map State-wide Distribution of Vernal Pools Steven D. Faccio, Michael Lew-Smith, Aaron Worthley + ABSTRACTVernal pools are typically small, shallow wetlands characterized by alternating flooded and dry phases. Yet, despite their small size and ephemeral nature, they support a rich assemblage of invertebrates and breeding amphibians. Many of these species are considered High and Medium priority Species of Greatest Conservation Need (SGCN) in the Vermont Wildlife Action Plan, including Ambystomid salamanders, Odonates, Fairy Shrimp (Eubranchipus spp.), and freshwater snails. However, due to their small size and seasonal nature, most vernal pools do not appear on National Wetland Inventory maps and their location and distribution across Vermont was largely unknown. We used color infrared aerial photo interpretation to map the location of “potential” vernal pools statewide, and trained citizen scientists to help field-verify a proportion of mapped pools. A total of 4,856 “potential” vernal pools were mapped statewide. Of these, 636 (13%) were field-visited; 54% of which were confirmed to be vernal pools. However, 71% (n = 207) of sites that were not pools were other types of wetlands (e.g. beaver ponds, shrub swamps, seeps, etc.), while only 13% were artifacts of remote mapping, primarily shadows from conifers. Among field-verified pools, the most commonly detected species were Lithobates sylvatica and Ambystoma maculatum, found breeding in 78% and 73% of confirmed pools respectively. A. Jeffersonianum was found in 10% of confirmed pools, A. Laterale in 3% of pools, and Eubranchipus spp. in 5% of pools. At least 115 volunteers participated in field-verification of vernal pools, submitting data from 301 field visits. + VIDEO+ PRESENTATION | Engaging Students in Resource Management & Monitoring through Experiential Education Elise Schadler + ABSTRACTThe Rubenstein School of Environment and Natural Resources (RSENR) at UVM has identified community engagement as one of three core focus areas in its recent strategic planning efforts, highlighting experiential education (internships, service-learning courses, and applied research) as an integral component. Service-learning is a High Impact Practice that gives students the opportunity to both apply what they are learning in the classroom in real-world settings and reflect in a classroom setting on their service experiences. In RSENR, service-learning courses such as NR 1: Natural History and Field Ecology, NR 25: Measurements & Mapping, FOR 235: Forest Ecosystem Health, NR 140: Applied Environmental Statistics, and NR 206: Environmental Problem-solving & Impact Assessment, students are engaged in diverse projects that help a variety of community partners better understand and monitor forest resources, from rural to urban, parcel-level to landscape-level. In 2012 RSENR entered into a partnership with the Vermont Urban & Community Forestry Program to fund a position that would both support service-learning courses in RSENR and align UVM students with municipal and volunteer forestry needs statewide; in the first year and a half of partnership, 21 service-learning projects and 3 internships specifically focused on urban and community forestry have been completed. This presentation is intended to inform VMC stakeholders of opportunities to engage in service-learning and internships in RSENR to achieve forest management and monitoring goals, how RSENR’s Office of Experiential Learning can facilitate partnerships, and to present the value of these partnerships have for students, faculty, and community partners. + VIDEO+ PRESENTATION | Predicting Calcium Content and Lithology of Glacial Till in the Green Mountain National Forest Gus Goodwin + ABSTRACTFor many forest soils in Vermont, the availability of nutrients, such as calcium, is determined by the lithology of glacial till, not bedrock. Till composition is variable and can differ dramatically from the underlying bedrock, but is largely unmapped. For both land managers and researchers, such a map would be valuable, as it would provide insight into nutrient cycling, spatial patterns in species diversity, and buffering of soils and streams against acidification.
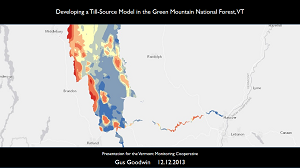
I applied a source-area model to predict till lithology and calcium content across the Green Mountain National Forest (GMNF). The model identifies bedrock sources in the geographic area where the till likely originated and computes their relative contribution to the till. By tying these predictions to geochemical analyses of bedrock units, the model can estimate the concentration of individual elements in till. In my initial model, I used a wedge-shaped source area defined by a 32km radius and 60° arc centered along the mean direction of ice flow during the last glacial maximum (148°). Using a database of 550 geochemical analyses, I assigned estimates of calcium content to all rock types that could be found in till in the GMNF.
With this, I generated a map of calcium content in till, that shows strong gradients in calcium availability across the GMNF, with the highest values reported for the Taconic Mountains and western Green Mountains and the lowest values in the central and eastern Greens. Sampling of till exposures and soil pits is being used to test the validity of the model predictions.
Products of my research, to date, include 1.) a comprehensive database of VT bedrock chemistry; 2.) a statewide map of calcium content in bedrock; and 3.) a preliminary map of calcium gradients in till within the GMNF. + VIDEO+ PRESENTATION |
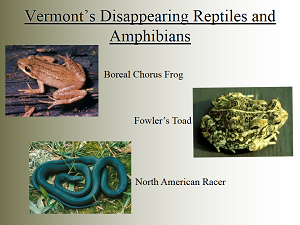
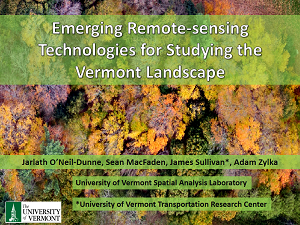
Long-Term Monitoring of Forest Soil Mercury by the Vermont Monitoring Cooperative Don Ross, Jamie Shanley, Scott Bailey, Thom Villars, Sandy Wilmot, Nancy Burt, Neil Kamman + ABSTRACTOngoing monitoring of mercury concentration in soils is essential for detecting, predicting and addressing environmental change. In cooperation with the Vermont Monitoring Cooperative, we have established a long-term soil monitoring study in five forested plots, three on Mt. Mansfield and two in the Lye Brook Wilderness Area. Elevation ranges from 590 to 1140 m with forest type changing from typical northern hardwood (Acer saccharum, Betula alleghaniensis and Fagus grandifolia) to high-elevation spruce-fir (Picea rubens and Abies balsamea). Each 50 x 50 m plot contains 100 5 x 5 m subplots with sampling date assigned randomly (10 per date). The initial sampling of these plots took place in the summer of 2002 and resampling occurred in 2007 and 2012. Small pits were dug in the center of each plot and the soils were sampled both by genetic horizon and depth increments. These samples have been analyzed for a suite of chemical parameters, including exchangeable cations, carbon and nitrogen. Separate samples of the uppermost humified horizon (Oa or A) were taken for total mercury analysis using appropriate protocols. Average mercury concentration at each site ranged from 162 to 444 ug/g (standard error 7-56 ug/g). The average carbon concentration in these horizons varied between 97 and 417 g/kg. There was clearly a positive gradient of mercury concentration with elevation, consistent with greater deposition (and with other studies). The highest concentration was found near the ‘forehead’ of Mt. Mansfield and may pose a threat to high-elevation species, such as Bicknell’s thrush. Challenges of the monitoring study include within site variability, continuity of sampling efforts and difficulties in sustaining support. Continued sampling at 5-year intervals will allow detection of environmental change in response to both a changing climate and changing mercury deposition. + VIDEO+ PRESENTATION | Vermont’s Disappearing Reptiles and Amphibians: Boreal Chorus Frog, Fowler’s Toad, and North American Racer James S. Andrews + ABSTRACTThe Vermont Monitoring Cooperative has supported both intensive amphibian monitoring at Mt. Mansfield and Lye Brook Wilderness and extensive monitoring of reptiles and amphibians throughout the state. Without this effort we would not know what species were once found in Vermont and as a result would not know which species are increasing or decreasing in numbers or the extent of their range. Three of our native herptiles have not been reported in recent years. The Boreal Chorus Frog was last heard in Alburgh in 1999. The Fowler’s Toad was last seen in Vernon in 2007 and the North American Racer was last seen in Guilford in 2008. These are all edge of range species in Vermont. Two are at the northern extreme of their range (Fowler’s Toad and North American Racer), and one is at the southeastern extent of its range. We do not know what has caused the apparent disappearance of these species. I will present what we know about these three species in Vermont and nearby areas. + VIDEO+ PRESENTATION | Emerging Remote-sensing Technologies for Studying the Vermont Landscape Sean MacFaden, Jarlath O'Neil-Dunne, James Sullivan, and Adam Zylka + ABSTRACTRemote-sensing techniques have long been used to monitor and characterize landscapes, providing important information on the structure and function of forests and component ecosystems. Specific applications include tree-canopy mapping, change detection, wildlife-habitat analysis, and forest-health assessment. Nationally, this work has been materially aided by the increasing availability of high-resolution remote-sensing data and improved processing methods, permitting efficient mapping and analysis of extensive landscape areas. Given the often substantial costs of acquiring high-resolution imagery, however, some of the newer remote-sensing data types have not been widely used to map and monitor landscapes in Vermont. Fortunately, this data gap is now being addressed. This presentation describes two of the most exciting and useful high-resolution remote-sensing technologies that are emerging in the state: Light Detection and Ranging (LiDAR) imagery and Unmanned Aerial Vehicles (UAV). LiDAR captures landscape features in both the horizontal and vertical planes, meaning that it offers the potential to map not only forest cover but also structural complexity, making it useful for stand delineation, canopy-volume calculations, and carbon stock estimation. Additional applications include assessment of vernal pools and other landscape features that are heavily dependent on topography. Meanwhile, UAVs offer near real-time color imagery and 3D representation of ground features, providing rapid assessment of individual forest stands, streams, wetlands, and anthropogenic features. This capability could be especially helpful in the immediate aftermath of storm events, providing damage estimates and highlighting areas where mitigative action is required. It will also be very useful to site-specific monitoring efforts for which acquisition of traditional, extensive remote-sensing imagery would be cost prohibitive. + VIDEO+ PRESENTATION |
Peeking beneath the canopy: Insights from using i-Tree Eco to monitor Burlington’s urban forest James Duncan, Aswini Cherukuri and Emily Van Wagoner + ABSTRACTThe urban forest in Burlington, VT, provides diverse benefits to residents in the city and the surrounding area, including ecosystem services such as air and water filtration, temperature moderation, and carbon sequestration. But maintaining these services into the future will depend, in part, on careful monitoring of the forest’s condition over time for early warning signs of decline. In 2011, the Vermont Monitoring Cooperative used i-Tree Eco, a USDA Forest Service software suite, to design a monitoring framework for the city’s urban forest using 200 randomly located permanent plots throughout the city. Over a three year period, students from the University of Vermont’s Natural History and Field Ecology class worked with the VMC to survey 159 of these plots, gathering data on land use, ground cover, species, size, height, and crown condition. Using the i-Tree analysis services, preliminary estimates suggest that Burlington’s urban forest is in good condition overall, though certain species such as eastern white pine fall into poorer condition classes, and invasive species such as Norway maple and buckthorn are quite common. The forest is also providing substantial benefits, with estimates including sequestration of 730 metric tons of carbon per year, and roughly $200,000 saved in avoided health impacts from air pollution. Future work will focus on surveying the remaining plots in Burlington and substituting more locally appropriate valuation rates for certain services. Despite some challenges, there is significant potential to use the i-Tree Eco suite to monitor forest conditions in Burlington. Beyond the city, opportunities to utilize i-Tree for broader-scale monitoring of Vermont’s forested landscapes will also be discussed. + VIDEO+ PRESENTATION | Forests and the Vermont Tourism and Recreation Economy William Valliere, Lisa Chase, Robert Manning, and Greg Gerdel + ABSTRACTTourism and recreation are primary pillars of Vermont’s economy. Much of this tourism and recreation is based in and on Vermont’s forests and forest resources. Prominent examples include skiing, hiking, camping, maple and leaf-peeping. Indeed, from the “Green Mountain” moniker to the logos of successful Vermont brands, forests are essential to Vermont’s identity.
Healthy and productive forests are intimately and necessarily connected with healthy and productive communities and individuals in our state. By providing settings for recreation and tourism, forests infuse communities with economic, ecological and cultural resources. Likewise, communities and individuals seek to satisfy their economic, ecological and cultural needs via recreation and tourism in and around forests.
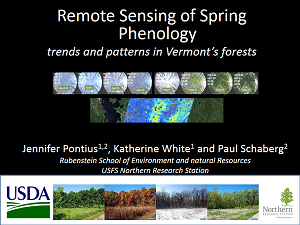
Understanding the social, economic and geographic impacts of Vermont tourism and recreation is an important of forest and natural resource management. A coordinated effort to understand these issues began in the spring of 2012 by surveying people who vacation and recreate in Vermont. Survey administration began in the summer of 2012 in selected state parks and selected attractions that are members of the Vermont Attractions Association. In October 2012, eight of Vermont’s Welcome Centers were included in the survey procedure. This report presents interim findings from the survey. These findings demonstrate the connections between Vermont’s forests and the state’s tourism and recreation, and suggest how understanding and managing tourism and recreation can complement forest resource science and management. + VIDEO+ PRESENTATION | Remote sensing of spring phenology in northeastern forests Jennifer Pontius, Katherine White and Paul Schaberg + ABSTRACTThe timing of vegetation development is one of the most clearly observed terrestrial responses to changing climate. Current remote sensing studies of foliage emergence have been limited to coarse spatial resolution and often lack a direct link to field measurements. To address this gap, we developed remote sensing techniques to assess start of spring using Landsat TM 30m imagery and extensive field measurements. This allows us to compare trends and patterns on a landscape scale in order to better understand how climate is impacting forested ecosystems. However, because of widespread cloud cover during the spring season, Landsat (16-day return) estimates of the start of spring were complimented by MODIS (250m, 8-day nadir return) to compare trends and patterns in historical phenology.
While year to year variability is high, our initial analyses of both Landsat and MODIS products indicate that spring is trending a half day earlier each year (Figure 1). In our Vermont study area, this change to earlier spring is most severe in lower elevation forests, closer to Lake Champlain, indicating that naturally warmer locations may be most sensitive. An examination of the larger MODIS coverage across the state shows that change to earlier spring is also more severe at higher latitudes.
These results suggest that climate change is impacting forest phenology over the past two decades, and that this change varies across our heterogeneous landscape. These changes likely have cascading impacts across forested ecosystems, from wildlife population dynamics to the economic vitality (sugar industry, tourism) of Vermont. + VIDEO+ PRESENTATION |
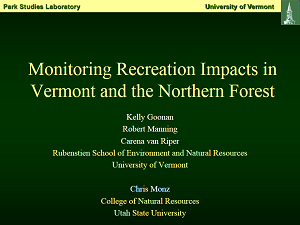
Integrated Social and Ecological Recreation Monitoring for Vermont’s Forests Nathan Reigner, Kelly Goonan, Carena van Riper, Jeremy Wimpey, Robert Manning, Chris Monz and William Valliere + ABSTRACTOutdoor recreation is an important use of and contributor to forest health. It is a primary mechanism by which communities benefit from and individuals develop relationships with forest resources. Recreational use can have deleterious impacts to forest resources including wildlife disturbance, vegetation damage, soil erosions, and water quality impairment, among other impacts. Additionally, the quality of recreation experiences is dependent in many ways on the character and quality of forest resources that provide the setting for recreation.
While environmental impacts from recreation and the quality of recreational experiences are often studies independently, they are less frequently understood in a coupled systems context. Innovative spatial and social research conducted on Vermont’s Camel’s Hump mountain demonstrates an approach to monitoring and analyzing the quality recreational experiences and forest resource quality in an integrated way.
The study monitors: 1) recreation related environmental resource conditions on Camel’s Hump, 2) recreationists perceptions of environmental quality and recreation related impacts, and 3) recreationists support for a range of management actions to mitigate impacts and enhance environmental quality.
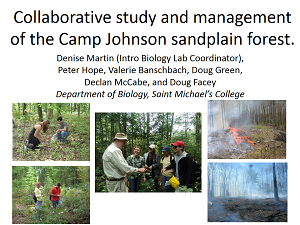
The study demonstrates an integrated and repeatable method for monitoring environmental and recreational conditions, quantifies social and ecological indicators of quality, identifies potential standards of quality for social and ecological conditions, and evaluates the acceptability of a range of management actions. This study illustrates an approach that could be adopted at a spectrum of recreation sites throughout Vermont to establish an integrated social and ecological recreational monitoring network. + VIDEO+ PRESENTATION | Collaborative study and management of the Camp Johnson sandplain forest Denise Martin, Peter Hope, Valerie Banschbach, Doug Green, Declan McCabe, and Doug Facey + ABSTRACTCamp Johnson, located in Colchester and controlled by the Army National Guard (ANG), contains one of the few remaining sections of sandplain forest habitat in Vermont. These forests are characterized by pitch pine (Pinus rigida) which require well drained, sandy soils and regular disturbance by fire. To maintain the sandplain forest community on the Camp Johnson property, controlled burns were conducted in 1995 (8 acres) and 1998 (the same 8 acres, plus an additional 6.5 acres).
Saint Michael’s College is located adjacent to Camp Johnson, and beginning in fall 2006 the Biology Department restructured its introductory biology program to include semester-long student projects studying plants and invertebrates of the sandplain forest. Class projects from 2006 to 2011 focused on comparisons of trees, shrubs, and arthropods in burned and nearby unburned areas. In addition, several independent student research projects have focused on the Camp Johnson forest. Sharing of information obtained through these studies led to additional discussions between the SMC Biology Department and ANG, and resulted in a decision to implement additional burns and gather pre- and post-burn data.
In spring of 2012, areas to be burned were cut, with some wood left in place to provide fuel. That summer, students and faculty from SMC gathered data on the vegetation and arthropods in some of these areas, as well as nearby areas that were not to be burned. In May of 2013, 4 acres were burned, and pitch pine seedlings were subsequently planted in this area. Post-burn data are now being gathered; and more area may be burned in 2014.
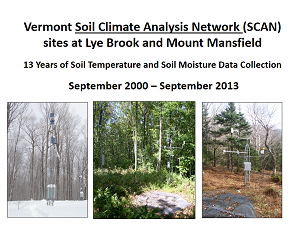
The SMC Biology Department intends to continue this collaboration with ANG through future courses and research projects. Examples of some of the questions asked and data gathered will be presented at the conference. + VIDEO+ PRESENTATION | Vermont’s Soil Climate Analysis Network (SCAN) sites at Lye Brook and Mount Mansfield – 10 years of soil temperature and soil moisture data collection Thomas Villars + ABSTRACTThe Soil Climate Analysis Network (SCAN) of the USDA Natural Resources Conservation Service (NRCS) is designed to collect soil moisture, soil temperature, and local climate information on a real-time basis. In September 2000, the Vermont Monitoring Cooperative (VMC) partnered with NRCS to install SCAN stations at the two VMC research and monitoring sites. Above-ground sensors provide the information required for climate analysis and evapotranspiration calculations and below-ground sensors provide soil temperature and soil moisture at five depths (2 inches, 4 inches, 8 inches, 20 inches, and 40 inches).
The soils at the two SCAN sites have similar temperature characteristics. Based on 2000-2010 data, the mean annual soil temperature is 7.3 deg C at Mount Mansfield (2235 feet elevation) and 6.9 deg C at the Lye Brook shaded site and 7.2 deg C at the open, less shaded site (both at 2435 feet elevation). There is very little change in soil temperature between the months of December and April, with the soils appearing to “hibernate” through the winter months. Temperature gradually drops to near 0 degrees C, with deeper layers being slightly warmer than surface layers. The coldest daily soil temperatures are in late March to early April. On an average monthly basis, March is the coldest month.
Similar to the Lake Turnover that occurs on large northern lakes, soils in northern climates undergo a spring and fall temperature turnover. In the summer, the upper layers of soil are the warmest, and in the winter, the deeper layers are warmest. Using SCAN data, a seasonal turnover in soils is defined as: the date at which the temperature of the 2 inch surface layer sensor crosses over (or under) the temperature of the 40 inch sensor for the season. The ten-year average date for the spring and fall turnover at the Vermont SCAN sites is mid-April and late September.
The soils at the two SCAN sites have similar moisture characteristics. The soils have the highest moisture content in the spring, typically in April. This seems to be more attributable to snowmelt than increased precipitation. All soils exhibit a drying-out in the summer months, regardless of precipitation levels. The 8-inch soil depth has the highest moisture levels – this is consistent in virtually all months of the year at both sites. There is a smaller moisture peak in the fall as trees start losing their leaves and evapotranspiration rates go down. Although not as distinct as in summer, there is a noticeable drop in soil moisture in winter.
Data is placed on the NRCS National Water and Climate Center SCAN website: http://www.wcc.nrcs.usda.gov/scan/. The website contains current and historical data for each SCAN site in the country. + VIDEO+ PRESENTATION |
A preliminary analysis of relationships between red spruce woody growth and high-resolution pollution critical loads and exceedance values for Vermont Paul Schaberg, Benjamin Engel, Gary Hawley, Shelly Rayback, Alexandra Kosiba, Jennifer Pontius and Eric Miller + ABSTRACTAcidic deposition depletes cations such as calcium (Ca) from forest soils and has been linked to the decline of red spruce trees in the northeastern United States. To better understand the spatial nature of the connection between Ca depletion and tree health and productivity, we used data from an existing geographically-referenced, steady-state model for New England and New York that produces fine scale (30 m) maps of critical loads (the capacity of a site to tolerate pollution) and exceedance (amounts to which incoming pollution exceeds the critical load) estimates for forests. We examined how woody growth (i.e., xylem basal area increment) of dominant and co-dominant red spruce trees within Vermont and New Hampshire is related to modeled estimates of critical loads and exceedance. This comparison was done by examining patterns of growth in red spruce xylem increment cores from sites with a wide range of modeled critical loads and exceedance levels. Exceedance was associated with average growth for the study period (1950-2010) overall, and for the 1970s and 1980s when acid deposition was at its highest, whereas critical load was associated with growth only for the most recent decade (2001-2010). An analysis of the rebound in growth from the region-wide 2003 red spruce winter injury event found that exceedance was linked with growth rebound both overall (2003-2010) as well as annually from 2006-2010, while critical load was not related to this rebound. Regression analyses found similar results, and may indicate potential linear relationships between exceedance and tree growth. Overall, our analyses suggest that modeled critical load and exceedance estimates can help account for tree growth variability and rebound from injury in the field, and that dendrochronological analysis may help infuse a temporal component to steady state critical load models that otherwise lack this context. Recent growth for red spruce exceeds average growth over the dendrochronological record – including growth decades before peak acid loading in the region. The cause of this recent surge in red spruce growth is currently unknown. | Maple syrup production declines following masting Joshua Rapp + ABSTRACTFlowering and seed production are energetically costly, which is hypothesized to play a role in driving masting dynamics. For spring-flowering species, energy is drawn from non-structural carbohydrate (NSC) stored in woody tissues. We hypothesized these same NSC stores provide the sugar in xylem sap that is tapped to produce maple syrup, and that maple syrup yields and seed production should be coupled. Specifically, we expected that in sugar maple, a masting species: 1) carbohydrate stores as measured by soluble sugars in xylem sap would be depleted after masting; and 2) seed production would increase after a resource threshold is reached. We tested these predictions at the landscape scale using monitoring data on seed production from the North American Maple Project provided by the Vermont Monitoring Cooperative, and maple syrup production from the United States Department of Agriculture National Agricultural Statistics Service. Maple syrup production data, detrended to remove a decade-long increase in syrup production reflecting greater harvesting effort, declined in the year following a mast year, demonstrating a cost of reproduction to trees, and maple syrup producers. We also found evidence for a resource threshold beyond which trees attempt reproduction, and a positive relationship between seed and syrup production in the same year. In addition, even though weather during the sugaring season is a strong predictor of sap flow, seed production was a stronger predictor of maple syrup production than climate alone, although a model containing both seed production and climate best predicted syrup production. Our results show that reproduction-driven internal resource dynamics of trees can have impacts on economic activity, and the importance of long-term monitoring data for testing ecological theory. + VIDEO+ PRESENTATION | A Proposed Vermont Water Monitoring Council – Results of a Needs Survey, and Next Steps Neil Kamman, Keith Robinson and Steve Gillespie + ABSTRACTDuring 2013, the VT Department of Environmental Conservation and US Geological Survey, in collaboration with the Vermont Monitoring Cooperative and several stakeholder organizations, pursued investigation of a statewide Water Monitoring Council. Through a series of meetings and outreach, the organizing partnership established a draft set of goals and objectives for a Statewide Council, consulted with other state water monitoring agencies, and considered the benefits conferred by these efforts to water management efforts in Vermont. As a result of this work, organizers developed and deployed a web-based survey to determine the interest, needs, and initial priorities of a Vermont Water Monitoring Council. A total of 113 survey responses, representing a 57% response rate, were received. This presentation will summarize the results of the survey, then propose next steps. + VIDEO+ PRESENTATION |
